Marketing & Analytics
Creating a three-part analytics system to organize how Weckerly’s Ice Cream plans, tracks, and evaluates marketing performance. Each dashboard focuses on a different part of insight: content planning, social performance, and Google profile analytics.
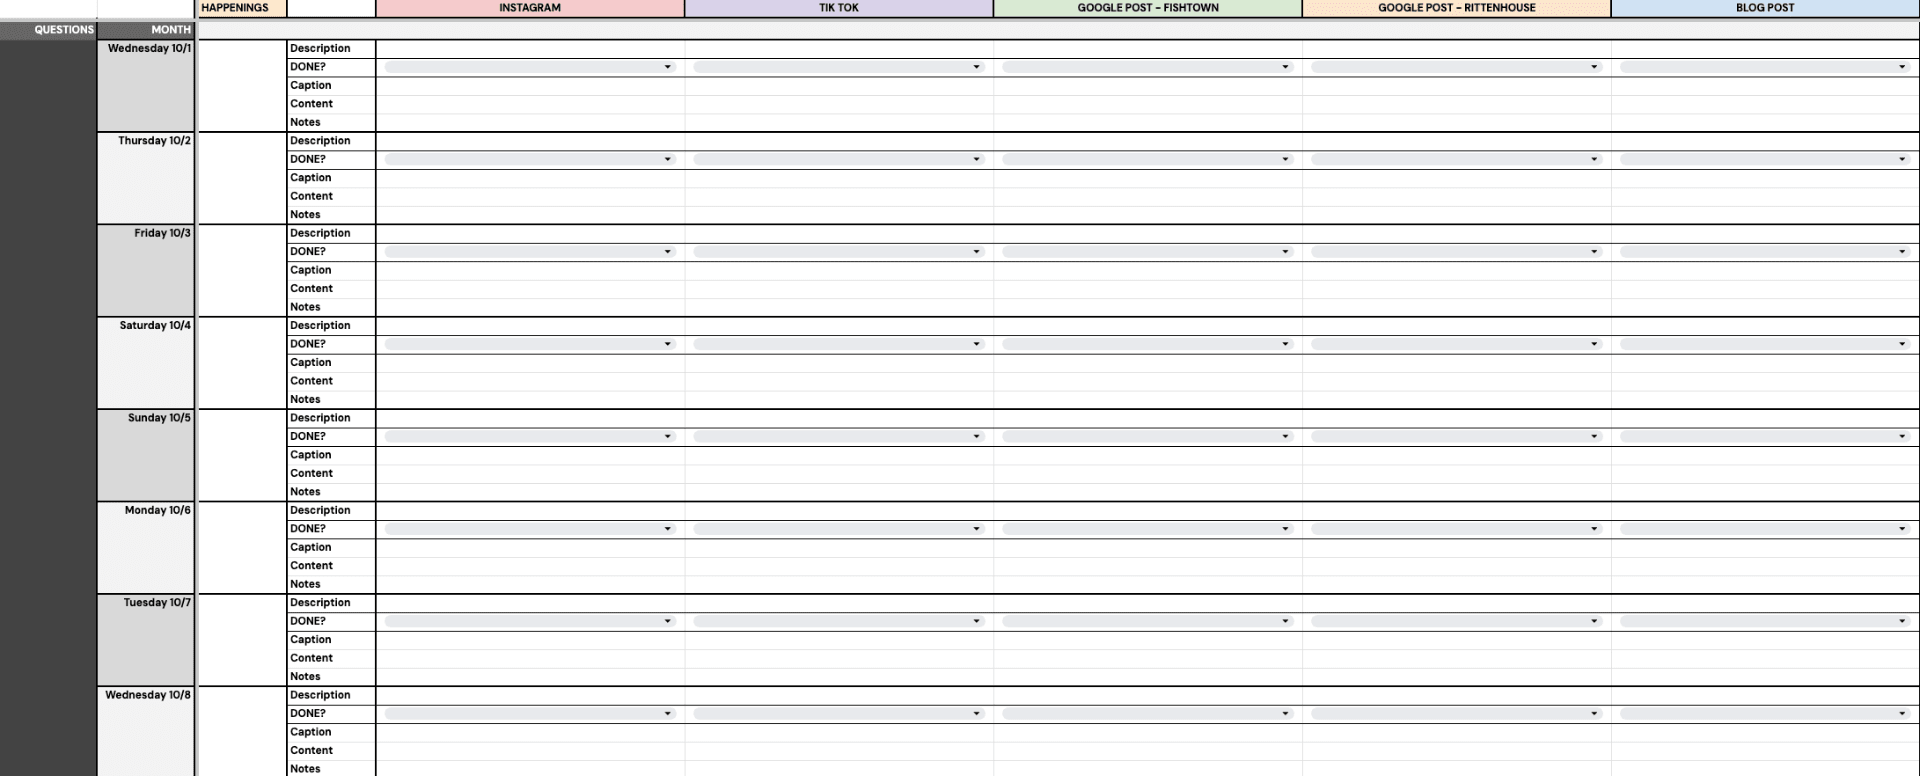
Social Media & Marketing CalendarA unified calendar that lays out every post, campaign, and event across Instagram, TikTok, Google, and the blog.
Organizes captions, visuals, and scheduling in one place
Links directly to live posts and analytics
Keeps all channels aligned under one strategy
Below is a blank version of the spreadsheet showing its overall structure and layout.
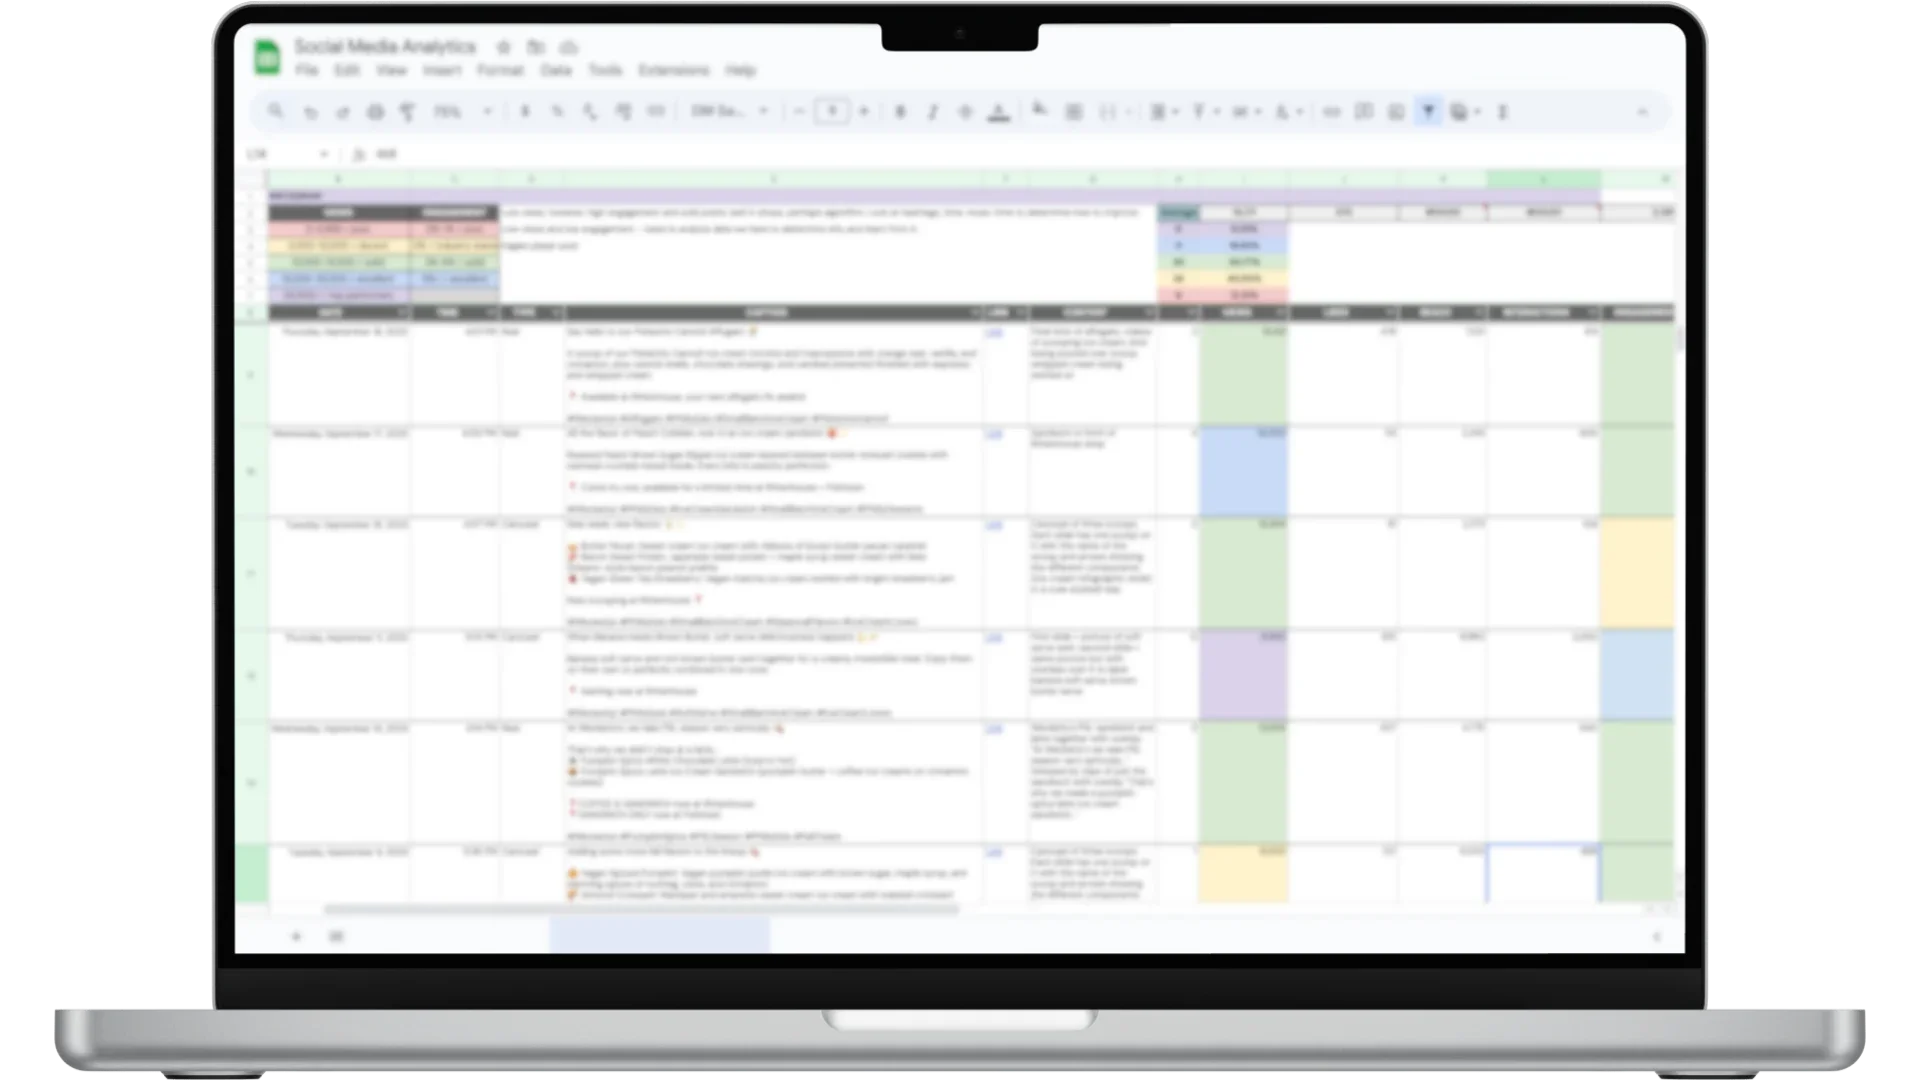
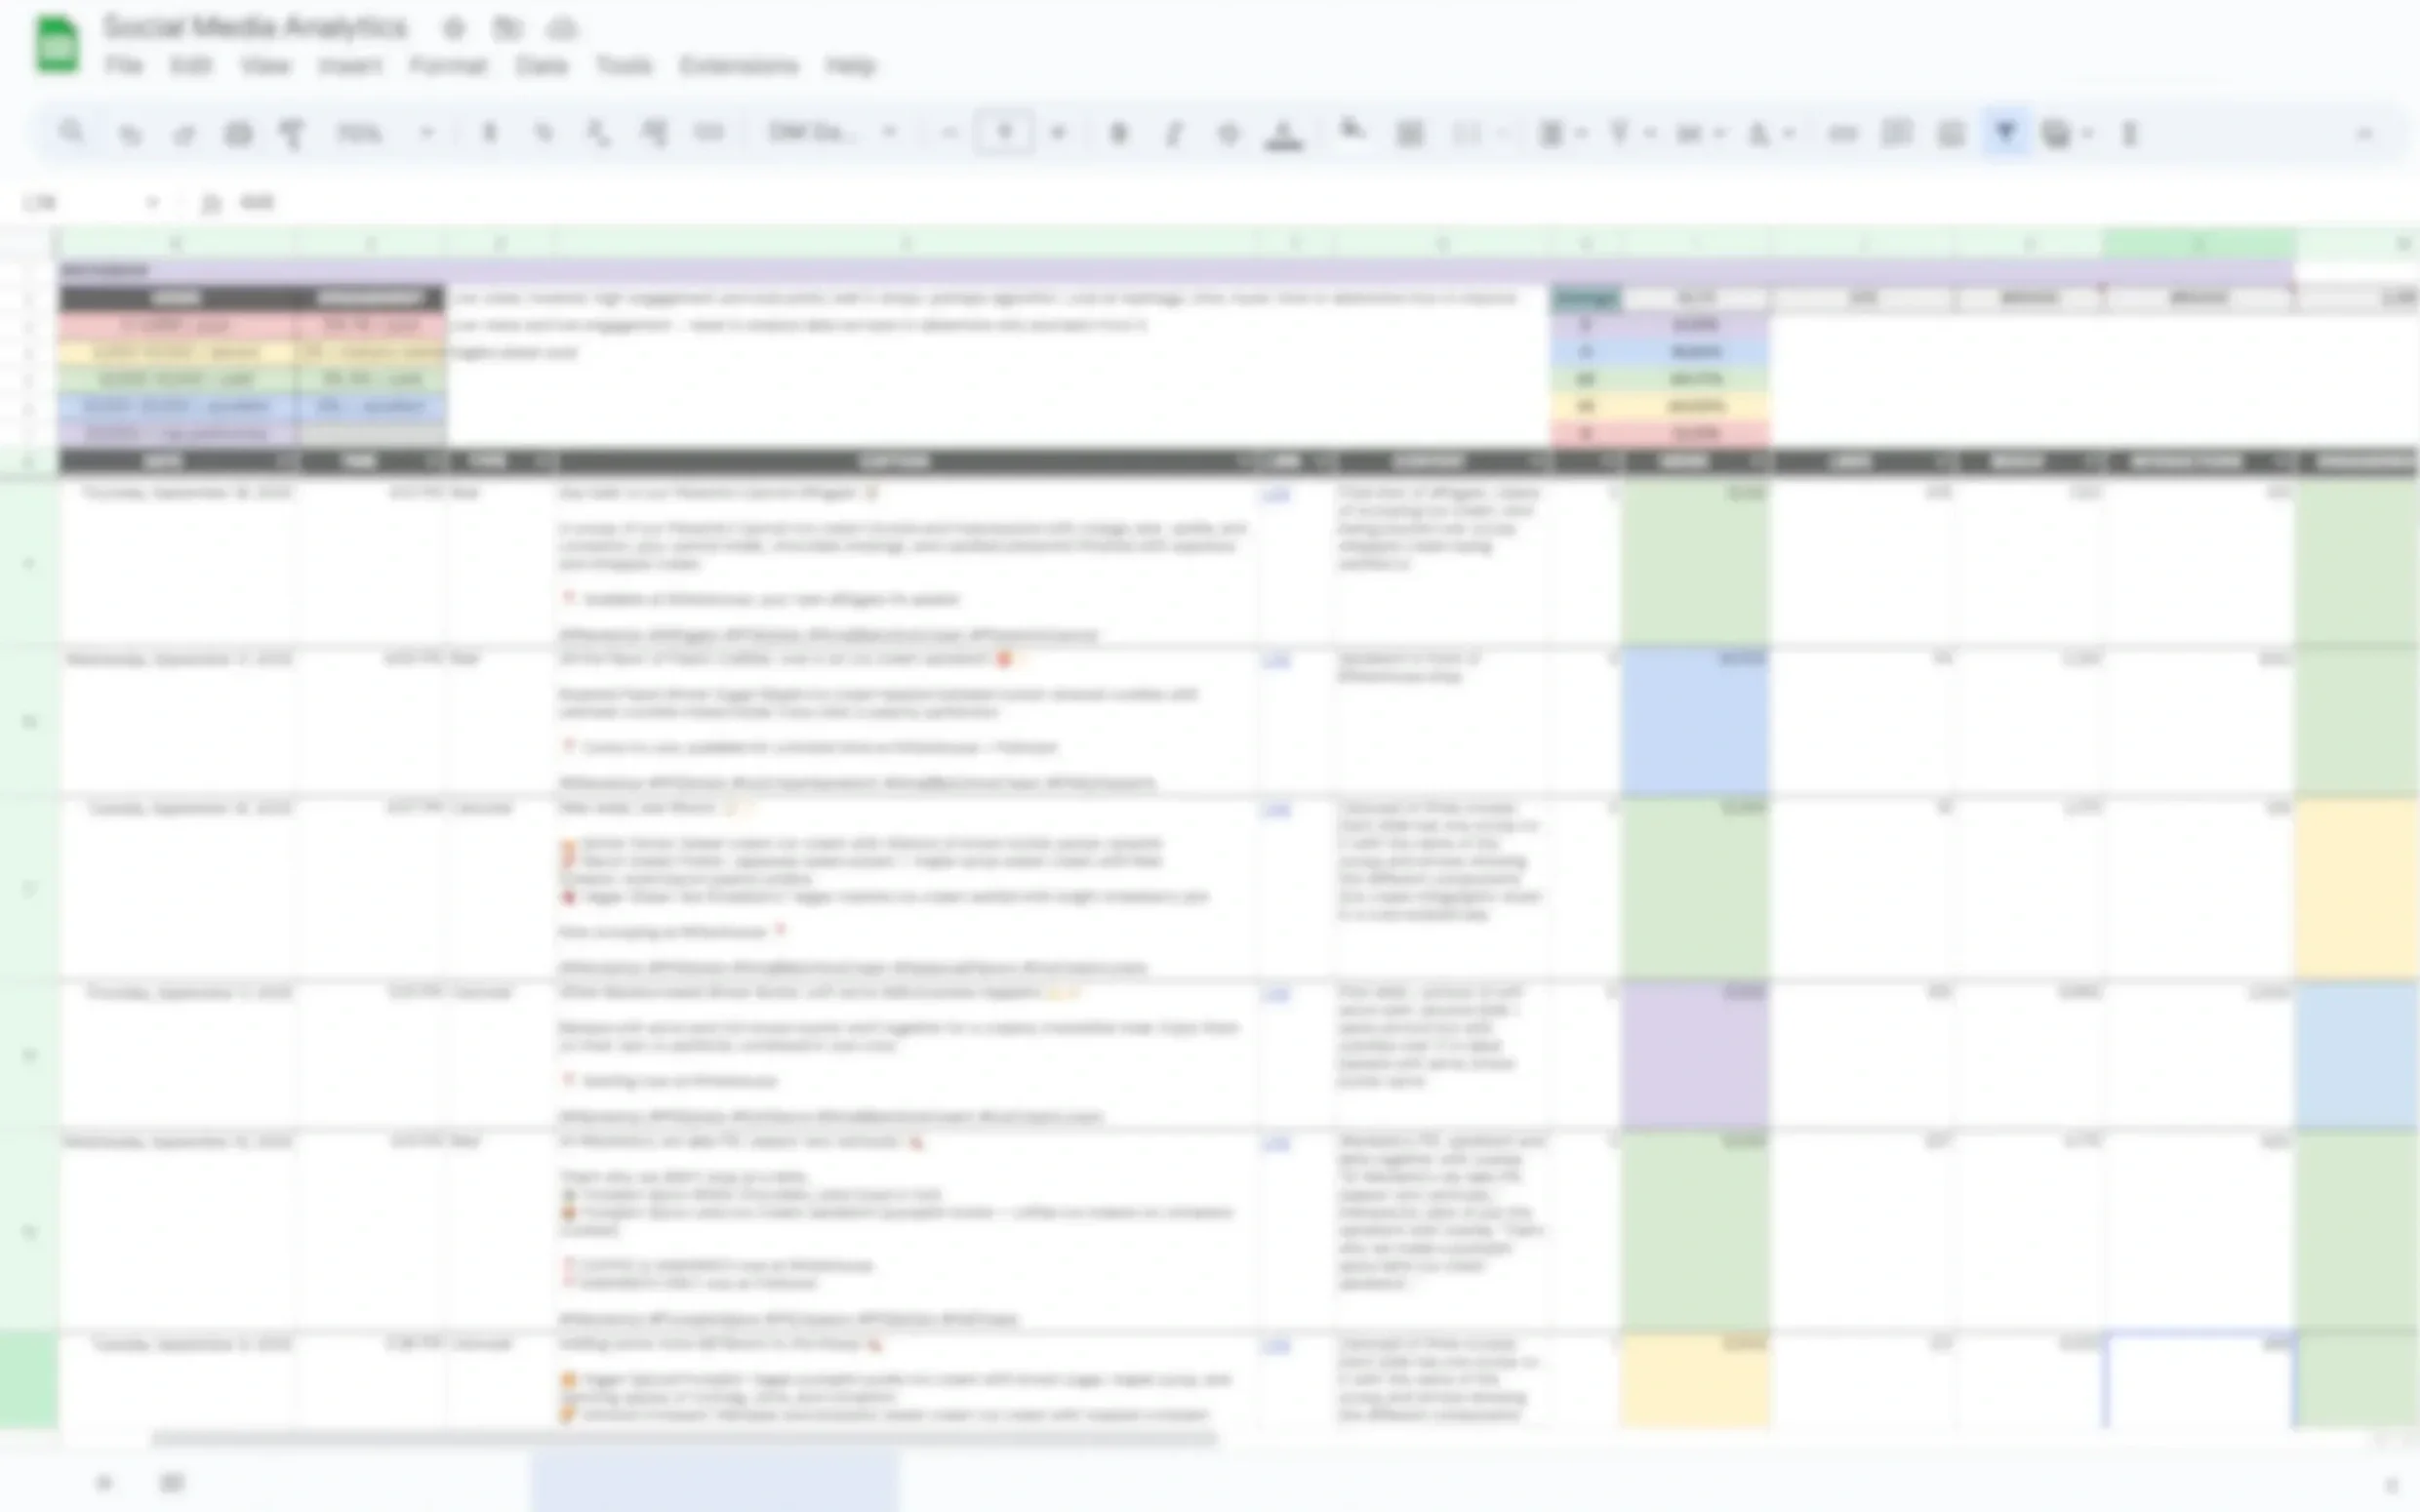
Social Media Analytics TrackerA dashboard that tracks performance and visualizes trends across all Instagram (primary platform) and Tik Tok posts.
Calculates engagement rate, reach, and impressions automatically
Identifies which content types and times perform best
Highlights month-to-month growth and audience trends
Instagram Highlights:
Average engagement rate: 4.08% (above industry standard of 1-3%)
Top-performing post: 6.76% engagement, 155,000+ views
10% of posts surpassed 25,000 views
17% of posts reached 15,000–25,000 views
Below is a blurred version of the analytics tracker, shown filled to demonstrate its layout, color-coding, and overall functionality while keeping data confidential.
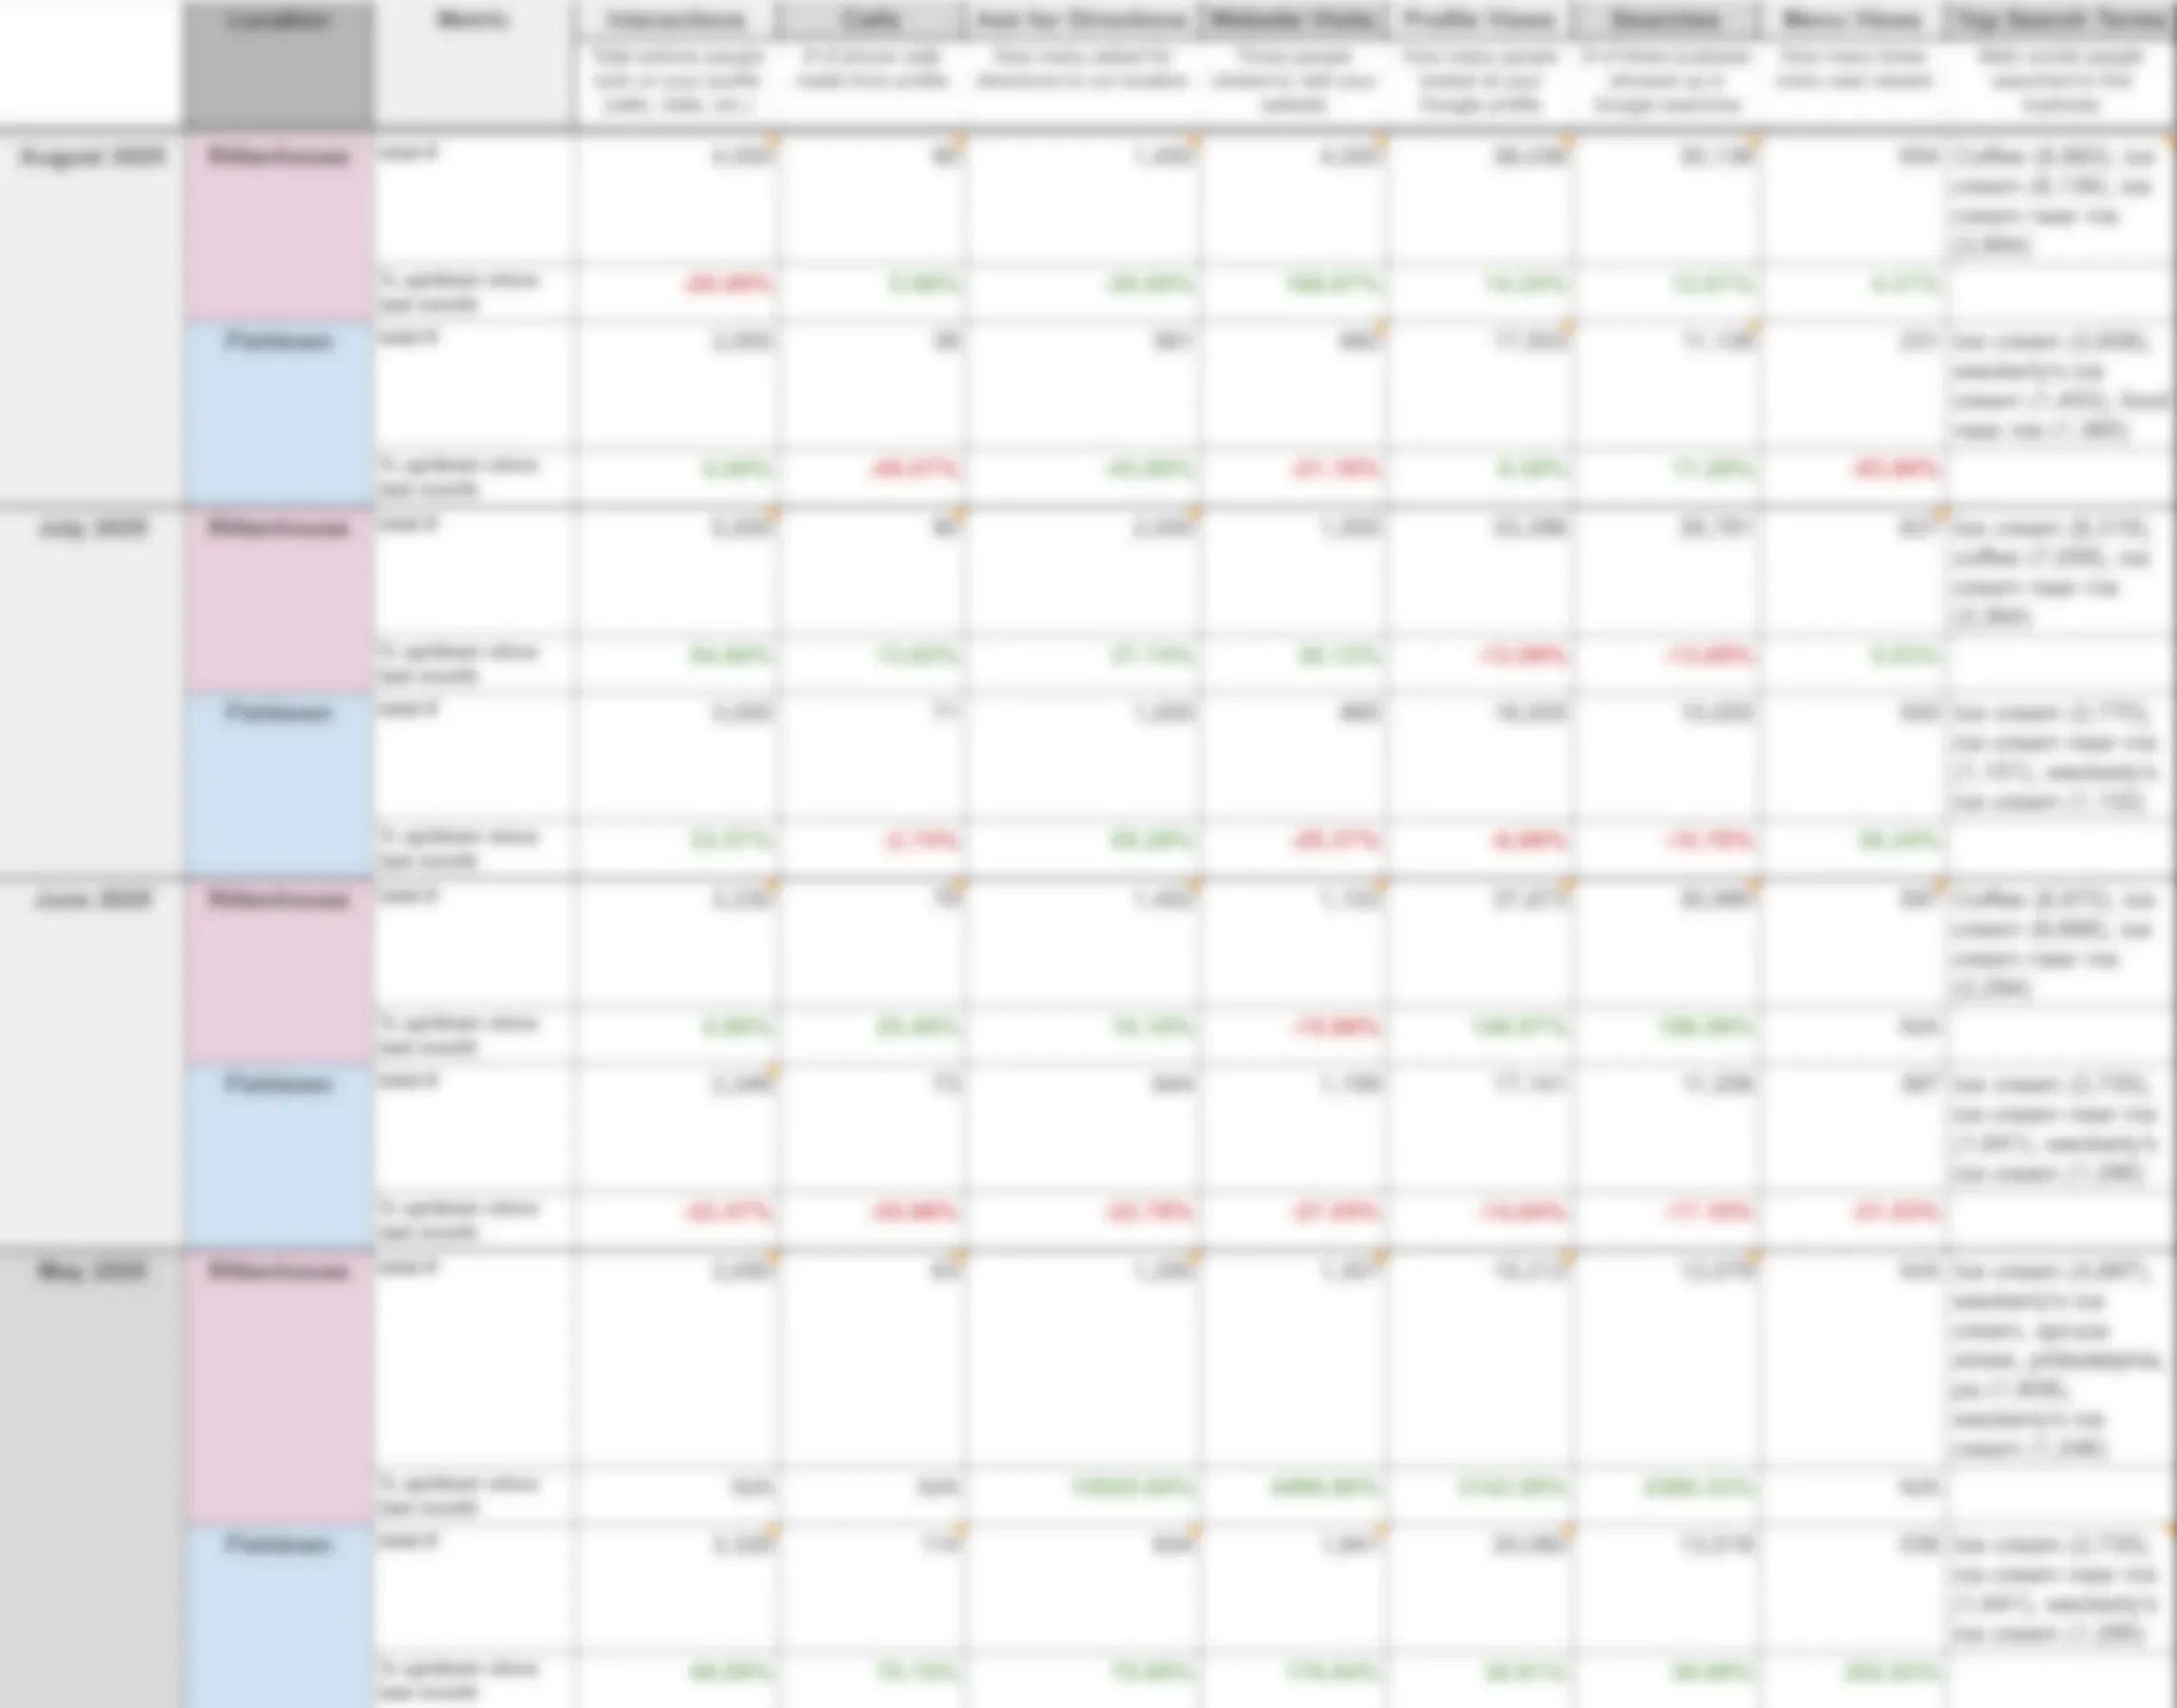
Google Profile Analytics TrackerA spreadsheet that collects and visualizes data from Google Analytics and the business profile.
Tracks searches, clicks, and profile interactions over time
Shows correlations between campaigns and search traffic
Includes space for notes and monthly insights
Below is a blurred version of the analytics tracker, shown filled to demonstrate its layout, color-coding, and overall functionality while keeping data confidential.
The system unified multiple reporting tools into a single, consistent process for planning, tracking, and analyzing performance.
Simplified how data is interpreted and used to guide creative choices
Improved visibility into results and performance trends
Encouraged a more reflective, data-driven design process
This project brought together marketing, analytics, and UX thinking. It made the creative process more intentional and gave leadership a clear understanding of what drives engagement and growth.
Outcome